Load Profile Section
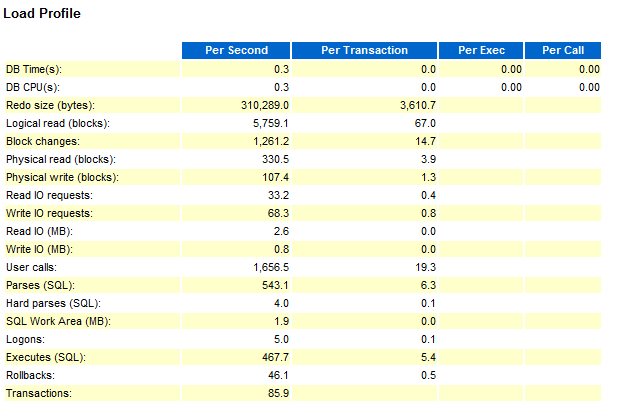
Redo size: Indicates the amount of DML activity (insert, update or delete operations) happening in the database
Logical and physical reads: Represents number of I/O (physical and logical) that the database is performing.
User calls: Indicates how many user calls have occurred. This value can give you some indication if usage has increased.
A user call occurs when a database client asks the server to do something, like logon, parse, execute, fetch etc. This is an extremely useful piece of information, because it sets the scale for other statistics (such as commits, hard parses etc.).
In particular, when the database is executing many times per a user call, this could be an indication of excessive context switching (e.g. a PL/SQL function in a SQL statement called too often because of a bad plan). In such cases looking into SQL ordered by executions will be the logical next step.
Parses and hard parses: Provides an indication of the efficiency of SQL re-usage
Logical and physical reads: Represents number of IO's (Physical and logical) that the database is performing.
Sorts: Number of sorts occurring in the database
Sort operations consume resources. Also, expensive sorts may cause your SQL fail because of running out of space in the temporary tablespace. So obviously, the less you sort, the better (and when you do, you should sort in memory).
Logons: Number of logins which occurred in the database
Establishing a new database connection is expensive (and even more expensive in case of audit or triggers). Logon storms are known to create serious performance problems. If you suspect that high number of logons is degrading your performance, check connection management elapsed time in Time model statistics.
Executes: Number of SQL statements which were executed
Executes statistic is important for analyzing performace, and it is related to what has been said above in user calls and parses and hard parses sections.
Transactions: Indicates how many transactions occurred
This is another important statistic, both on the general (i.e. creating context for understanding the rest of the report) and specific (troubleshooting performance problems related to transaction control) levels. The AWR report provides information about transactions and rollbacks, i.e. the number of commits can be calculated as the difference between the two. Rollbacks are expensive operations, and can cause performance problems if used improperly (i.e. in tests, to revert the database to the original state after testing), which can be controlled either by reducing the number of rollbacks or by tuning rollback segments. Rollbacks can also indicate that a branch of code is failing and thus forced to rollback the results (this can be overseen if resulting errors are not processed or rethrown properly).
Excessive commits can lead to performance problems via log file sync waits
How many is excessive? This entirely depends on the database. Obviously, OLTP databases commit more than DWH ones, and between OLTP databases the numbers can vary several orders of magnitude. Generally, if commits per second are below 10-20 then there is seldom a problem, and above 100-200 there typically always is a problem (when not sure, look in top timed events: if there are no log file sync waits up there, then you are probably okay!).
Parses: The total of all parses; both hard and soft
A parse is analyzing the text of the query and optionally, optimizing a plan. If plan optimization is involved, it is a hard parse, otherwise a soft parse.
As we all know, parsing is resource expensive. Excessive parsing can cause performance problems (one moment your database seems fine, the next moment it comes to a complete standstill). Another bad thing about excessive parsing is that it makes troubleshooting of poorly performing SQL much more difficult.
How much hard parsing is acceptable? It depends on too many things:
- Number of CPUs
- Number of executions
- Sensitivity of plans to SQL parameters
But as a rule of a thumb, anything below one hard parse per second is probably okay, and everything above 100 per second suggests a problem (if the database has a large number of CPUs, say, above 100, those numbers should be scaled up accordingly). It also helps to look at the number of hard parses as % of executions (especially if you are in the grey zone).
If you suspect that excessive parsing is hurting your database performance:
- Check time model statistics section (hard parse elapsed time, parse time elapsed etc.)
- Check if there are any signs of library cache contention in the top-5 events
- Check if CPU is an issue.
If that confirms your suspicions, then find the source of excessive parsing (for soft parsing, use SQL by parse calls; for hard parsing, use force_matching_signature) and see if you can fix it.
Hard Parses: The parses requiring a completely new parse of the SQL statement. These consume both latches and shared pool area.
Soft Parses: Soft parses are not listed but derived by subtracting the hard parses from parses. A soft parse reuses a previous hard parse; hence it consumes far fewer resources